1. It has been proposed that Ca2+ signaling, in the form of pulses, waves and steady gradients may play a crucial role in key pattern forming events during early vertebrate development.
2. With reference to the embryo of the zebrafish (Danio rerio), here we review the Ca2+ transients reported from the Cleavage to Segmentation Periods. This time-window includes most of the major pattern forming events of early development, which transform a single cell zygote into a complex multicellular embryo with established primary germ layers and body axes.
3. Data are presented to support our proposal that intracellular Ca2+ waves are an essential feature of embryonic cytokinesis, and that propagating intercellular Ca2+ waves (both long and short range), may play a crucial role in: (a) the establishment of the embryonic periderm, and (b) the coordination of cell movements during epiboly, convergence and extension, as well as contribute to (c) the establishment of the basic embryonic axes and germ layers, and (d) the definition of the morphological boundaries of specific tissue domains and embryonic structures, including future organ anlagen.
4. The potential down-stream targets of these Ca2+ transients are also discussed as well as how they might integrate with other pattern-forming signaling pathways, known to modulate early developmental events.
There is an accumulating body of evidence to suggest that Ca2+ signaling plays a major role in the regulation of embryogenesis.1-4 Indeed, like developmental patterning itself, the earliest Ca2+ signaling events are distinct, and can be correlated with specific morphogenetic steps. As embryonic complexity increases, however, so does the complexity of the Ca2+ signals observed. These characteristics are exemplified in the developing zebrafish (see Figure 1). The early phases of development (for example, during cytokinesis in the Cleavage Period; CP), are dominated by intracellular Ca2+ signals. However, as the number of cells increases and the size of the cells decreases (i.e., during the Blastula Period (BP) and early Gastrula Period (GP)), there is a progressive establishment of localized intercellular signals in conjunction with the intracellular signals. With the commencement of the dramatic morphological events and global patterning processes that occur later in the GP, there is the concomitant generation of longer range, and even pan-embryonic, intercellular Ca2+ signals. However, by the end of the GP and during the subsequent Segmentation Period (SP), when the germ layers and major body axes are established, a more localized pattern of intercellular Ca2+ signaling then resumes. This is associated with the generation of specific structures within the basic body plan, such as somite formation, brain partitioning, and tail elongation.
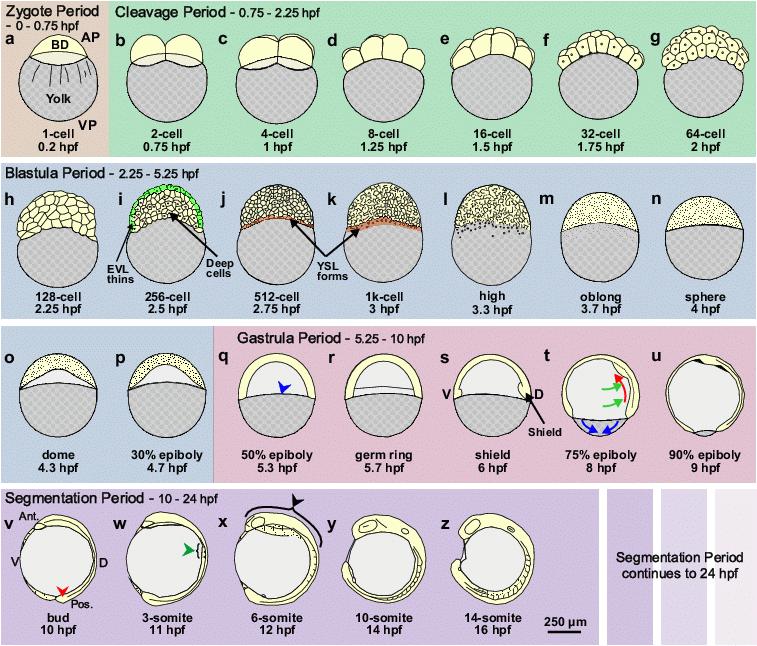
Figure 1. Schematic representation of zebrafish development from the Zygote Period to the mid-Segmentation Period. Following the brief Zygote Period (panel a), when the embryo is at the single-cell stage, the CP (panels b–g) runs from the 2-cell to 64-cell stage (i.e., 0.75 hpf to 2.25 hpf). The BP (panels h-p) follows the CP, and runs from the 128-cell stage to the 50% epiboly stage (i.e., from 2.25 hpf to 5.3 hpf). The formation of the EVL and YSL are indicated in panels i, and j and k, respectively. The GP (panels q-u) then runs from the end of the BP at 50% epiboly (i.e., 5.3 hpf) through to bud stage at 10 hpf, after which the SP begins. In this schematic, we have just shown the early stages of the SP (panels v-z), i.e., from bud stage (at 10 hpf) to the 14-somite stage (at 16 hpf). AP, VP, EVL, Ant. Pos. and hpf are animal pole, vegetal pole, enveloping layer, anterior, posterior and hours post fertilization, respectively. BD (in panel a) indicates the blastodisc, at the 1-cell stage, which develops into the blastoderm during subsequent stages of development. In the GP, the leading edge of the blastoderm is indicated by a blue arrowhead in panel q. The dorso-ventral axis is first visible morphologically at Shield stage (i.e., 6 hpf; panel s). The simultaneous cell movements of epiboly (blue arrows), convergence (green arrows) and extension (red arrows) that occur during the GP, are shown in panel t. The tail bud, somites and brain anlage are indicated by red, green and black arrowheads, respectively in panels v, w and x. Schematics are modified from Kimmel et al.,16 where there is a detailed description of the early development of zebrafish embryos.
In this review, we describe the latest findings regarding the Ca2+ signaling events that occur during these early stages of zebrafish development, and in doing so, we hope to provide evidence that instead of being discrete and disconnected events, Ca2+ signals may be a continuous and fundamental feature of developmental orchestration, with (at least where it is known) largely conserved molecular and cellular mechanisms of generation.
Direct visualization of the patterns of Ca2+ signals that are generated during embryogenesis is commonly achieved using either bioluminescent or fluorescent Ca2+ reporters in conjunction with specialized luminescent imaging equipment or confocal microscopy, respectively. The most common bioluminescent Ca2+ reporter used for imaging is aequorin,5 while a wide range of fluorescent Ca2+ reporters are commercially available.6 These include both single wavelength reporters such as Calcium green-1 dextran and ratiometric reporters such as Fura-2. There are advantages and disadvantages to utilizing both the luminescent and fluorescent Ca2+ reporters.7 While aequorin is able to provide a continuous, low-resolution map of the developmental Ca2+ signaling events that occur over relatively long periods of time, fluorescent Ca2+ reporters generally provide shorter time-frame information at a higher resolution regarding the particular cells or tissues that generate a specific Ca2+ transient within an embryo. Thus, we suggest that the combined use of these two complimentary Ca2+ imaging techniques provides a powerful tool for the visualization of Ca2+ signals in developing embryos.
The existence of intracellular Ca2+ transients during the early embryonic cleavages (see Figure 1, panels b – g) in zebrafish (Danio rerio), have been identified using both fluorescent and luminescent Ca2+ reporters. Using Calcium green-1 dextran, Chang and Meng8 observed that localized elevations in free Ca2+ were associated with cytokinesis and they demonstrated that intracellular Ca2+ was elevated ‘not only in the “right” place, but also at the “right” time’ to play a role in determining the position of the furrowing plane.
Webb et al.9 confirmed this observation using aequorin-based imaging and observed that several distinct Ca2+ signals accompany the sequential stages of cytokinesis. The ‘furrow positioning signal’ is a clear, localized elevation of intracellular Ca2+, which precedes the first appearance of the furrow arc at the blastodisc surface. This is followed by the ‘furrow propagation signal’, which takes the form of two sub-surface slow Ca2+ waves moving at ∼0.5 μm/s, which accompany the leading edges of the furrow arc as they progress outward toward the margins of the blastodisc. As these propagation wave fronts approach the margins of the blastodisc, the ‘furrow deepening’ Ca2+ signal then appears at the apex of the blastodisc, i.e., at the same initial location as the positioning signal. Like the propagation signal, it extends outward to the margins of the blastodisc at ∼0.5 μm/s, but in this case it also moves downward (at ∼0.1 μm/s), accompanying the deepening process that separates the daughter cells.9 The region of localized elevated Ca2+ then persists throughout the furrow apposition process, and only returns to the resting level once the cleavage furrow is fully apposed.10 The peak amplitude of the positioning, propagation and deepening Ca2+ transients was estimated to be ∼650 nM for the positioning and propagation transients and ∼440 nM for the deepening transient.9 This sequence of Ca2+ signals was also observed during the second cell division cycle.9 Figure 2A shows a representative animal pole view of an f-aequorin-loaded zebrafish embryo demonstrating the changes in intracellular free Ca2+ during positioning, propagation, deepening and apposition of the first and second cell division cycles. More recent reports have also confirmed that such localized increases in Ca2+ occur in zebrafish embryos during the different phases of cytokinesis using both aequorin and fluorescent Ca2+ reporters.11,12
As well as the direct visualization of the CP Ca2+ transients, there is also good indirect evidence (for example, from injecting Ca2+ chelators such as BAPTA-type buffers at distinct times during the cell cycle) to indicate that Ca2+ signaling plays a required role in cytokinesis in zebrafish embryos.8-13 The timing of introduction of a Ca2+ chelator (and knowledge of its rate of spread within an early embryo) is critical for determining its effect on the generation of a particular transient as well as the developmental significance of blocking or modulating that transient. Taking this into account, Webb et al.9 initially focused on the propagation transient, and waited until the furrow had been positioned on the blastodisc surface (by observing either the appearance of the furrow on the surface or the Ca2+ transient associated with this event) before introducing the buffer. These experiments clearly indicated a Ca2+-requirement for furrow propagation in cleaving zebrafish embryos. Subsequently, and again by careful timing of the introduction of the Ca2+ buffer, Lee et al. more recently demonstrated that a localized elevation of Ca2+ is also essential for both furrow deepening10 and furrow positioning13 in zebrafish embryos.
Zebrafish embryos have also been treated with antagonists of the various Ca2+ release channels in order to explore the Ca2+ stores responsible for the generation of the cytokinetic Ca2+ transients. Chang and Meng,8 demonstrated that the cytokinetic Ca2+ signal that they observed using Calcium green-1 dextran, was blocked via the introduction of heparin, an antagonist of IP3 receptors (IP3Rs), but was not affected by ryanodine (a ryanodine receptor antagonist), nifedipine and La3+, (inhibitors of plasma membrane Ca2+ channels) or the removal of Ca2+ from the external medium. They concluded that the cytokinetic Ca2+ transient arose from internal stores through the release of Ca2+ via IP3Rs.8 Webb et al.9 subsequently confirmed with aequorin that zebrafish embryos could generate a regular series of cytokinetic Ca2+ transients and divide normally (for at least the first few cell division cycles) in Ca2+-free medium, thus supporting Chang and Meng’s observation that extracellular Ca2+ is not involved in generating these transients.8 More recently, Lee et al.10,13 investigated the source of cytokinetic Ca2+ in further detail by carefully timing the introduction of the various antagonists in order to focus specifically on the deepening and positioning Ca2+ transients. They demonstrated that the introduction of heparin or another IP3R antagonist, 2-APB (2-aminoethoxydiphenylborate), at the appropriate time to challenge only the deepening transient, blocked the Ca2+ signal and resulted in an inhibition of furrow deepening.10 Antagonists of the ryanodine receptor and NAADP-sensitive channel, however, had no effect on either furrow deepening or on the deepening Ca2+ transient.10 In addition, they demonstrated that the endoplasmic reticulum (ER) and IP3Rs are both localized on either side of the cleavage furrow during the deepening process,10 thus providing additional evidence for the possible intracellular Ca2+ store and release mechanism for the deepening Ca2+ transient.
More recently, Lee et al.13 demonstrated that the positioning Ca2+ transient is also generated by Ca2+ release via IP3Rs. In addition, Lee et al.14 started to explore the upstream events that might be involved in organizing the furrow positioning Ca2+ transient and presented evidence to demonstrate that a dynamic array of microtubules may be involved. They showed that this array, which they termed the ‘pre-furrowing microtubule array’ (or pf-MTA), originates from the mid-zone of the mitotic spindle, and then expands both upward and outward toward the surface of the blastodisc.14 In addition, they showed that this pf-MTA is localised with a zone of corticular ER and IP3Rs in the blastoderm cortex just before the morphological appearance of the cleavage furrow at the blastodisc surface. Thus, they suggested that the array might be involved in organising the ER (and thus the IP3Rs), required to generate the Ca2+ signals that are essential for cleavage furrow formation in zebrafish embryos.14
Most recently, Li et al.15 investigated whether extracellular Ca2+ (i.e., Ca2+ in the medium surrounding the embryonic cells) in combination with SNARE complexes play a role in the membrane remodelling that occurs during furrow deepening and apposition. They demonstrated that two cognate SNARE partners, VAMP-2 and SNAP-25 mediate vesicle fusion at the deepening and apposing cleavage furrow membranes. In addition, they showed that vesicle fusion is not required for furrow deepening but is essential for apposition. Furthermore, their data suggested that extracellular Ca2+ is not required for VAMP-2 vesicle fusion, but confirmed that it is essential for successful daughter cell apposition.15
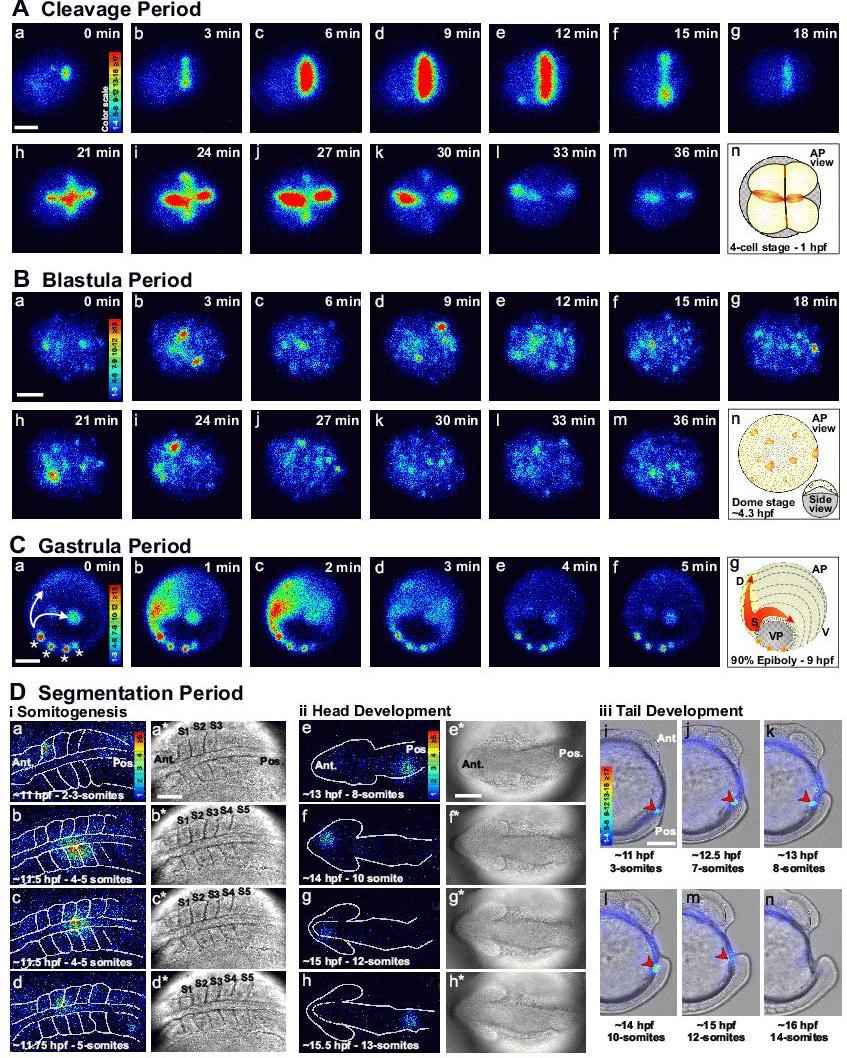
Figure 2. Representative examples of the Ca2+ signaling events that occur during the early development of zebrafish embryos. Imaging sequences are shown during: (A) the CP; (B) BP, and (C) GP as well as during (Di) somitogenesis, (Dii) head development and (Diii) tail formation in the early SP. (A) CP: Animal pole view of a representative embryo showing the first two cell division cycles (i.e., from the 1- to 4-cell stage). The luminescent images (pseudocolor panels, labeled a-m) represent 1 min of accumulated light with a 2-min gap between each image. (B) BP: Animal pole view of a representative Dome-stage (∼4.3 hpf) embryo. The luminescent images (panels a-m) represent 2 min of accumulated light with a 1-min gap between each image. (C) GP: oblique vegetal pole (VP) view of a representative embryo at ∼90% epiboly. The luminescent images (panels a-f) represent 2 min of accumulated light with a 1-min overlap for each image. In panel a, examples of non-propagating localized domains of elevated Ca2+ are marked with asterisks, and the intercellular Ca2+ waves, which are initiated at the shield and propagate both around the margin and along the embryonic axis, are marked with arrows. In the luminescent images in (A-C) the timing relative to the first panel in each sequence is shown in the upper right corner of each panel. The schematics (i.e., panel n in (A) and (B), and panel g in (C)) show the orientation of each embryo. (D) SP: (i, ii) Dorsal views of (i) the trunk and (ii) the head, and (iii) lateral view of representative embryos at various stages from the ∼2-3-somite to ∼14-somite stages. (i, ii) The luminescent images (panels a–h) represent 2 min of accumulated light. The corresponding bright-field images (panels a*-h*) were acquired just prior to each luminescent image. (iii, i–n) Luminescent images, representing 1 min of accumulated light, were superimposed on the corresponding bright-field image. The red arrowhead indicates the recurring tail-bud Ca2+ transient. Embryos were injected with aequorin and luminescent data were acquired with a photon imaging microscope, as described previously.9 Color scales indicate luminescence flux in photons/pixel. All scale bars are 200 µm except for Di and Dii where the scale bars are 100 µm. AP, VP, D, V, Ant., Pos. and hpf represent animal pole, vegetal pole, dorsal, ventral, anterior, posterior and hours post-fertilization, respectively.
The BP of zebrafish development (see Figure 1, panels h – p), which runs from the 128-cell stage to 50% epiboly,16 marks the beginning of a transition in the nature of the Ca2+ signals. As described in the previous section, the Ca2+ transients observed during the CP are exclusively intracellular.8,9,11 Then, as the cells get smaller and the embryo advances into the BP, there is a progression from intracellular to localized intercellular (i.e., cell-to-cell) Ca2+ signaling.17,18 This transition has been suggested to represent the beginning of an amalgamation of the basic elements of intracellular Ca2+ signaling into the higher order signaling networks that are necessary to keep pace with the increase in developmental complexity.3
Reinhard et al.17 recorded changes in Ca2+ during the BP by imaging embryos that were loaded with the nuclear fluorescent Ca2+ reporter, NuCa-green. They showed that starting during the late CP/early BP (i.e., from the 32- to 128-cell stage), Ca2+ transients, lasting ∼20–50 s, could be observed exclusively in the outer-most layer of cells. Reinhard et al.17 estimated that the BP Ca2+ signals might have peak amplitudes of between 300 – 1000 nM. This population of cells develops into the enveloping layer (EVL) at the 64-cell stage following the first horizontal cleavage, which results in two populations of cells; the ‘deep’ cells (DCs) on the inside of the blastoderm and the superficial EVL cells that cover them.16 The relative locations of the EVL and DCs are illustrated at the 256-cell stage in Figure 1 (panel i). This is the stage that the EVL cells begin to thin out and become a tightly sealed epithelial-like monolayer of cells which, later in development, differentiate into the periderm, a protective extra-embryonic layer that covers the blastoderm. Reinhard et al.17 reported that these transients remained restricted to the EVL and were initially generated by single cells. However, as the BP progressed, the transients increased in frequency and began to spread as propagating intercellular Ca2+ waves between small groups of ∼2-5 adjoining cells. The authors also demonstrated that the appearance of the EVL Ca2+ signals and intercellular wave generation coincided with increased levels of IP3 within the embryo. They proposed, therefore, that the Ca2+ transients visualized in the EVL might be generated via IP3-mediated Ca2+ release.17 The BP Ca2+ transients reported by Reinhard et al.17 using NuCa-green, can also be observed using aequorin, an example of which is shown in Figure 2B.
Using a Fura-2-dextran-based imaging technique, Slusarski et al.19 subsequently demonstrated that the frequency of Ca2+ spiking in the EVL cells in zebrafish could be modulated by the ectopic expression of Xenopus Wnt-5A. They also confirmed the involvement of the phosphatidylinositol (PI) signaling pathway by demonstrating that the interaction of Xwnt-5A and the Wnt receptor, Frizzled-2, triggers this signaling cascade and leads to the release of intracellular Ca2+.19,20 A recent report, however, indicated that purified Wnt-5A protein does not appear to influence cellular Ca2+ levels,21 and so the hypothesis that certain members of the Wnt family might be upstream triggers of BP Ca2+ signaling is still unresolved.
It has been suggested that the Ca2+ signals may mediate EVL cell adhesion or might be involved in patterning the dorso-ventral axis during this stage of zebrafish development.17,22 While there is no direct evidence that confirms a role for the BP Ca2+ signals in EVL cell adhesion in zebrafish, it has long been established that extracellular Ca2+ is required to maintain the integrity of blastula cells in Xenopus embryos.23 In addition, it has been shown that the cell adhesion that occurs in vertebrate epithelia in general is mediated by both adherens and tight junctions. While adherens junctions (via cadherins) are dependent on extracellular Ca2+, intracellular Ca2+ signaling may play a role in mediating the interaction between cortical cytoskeletal elements and the extracellular matrix. Moreover, tight junctions, which hold cells together and serve as an impermeable barrier, are reported to be dependent on both intracellular and extracellular Ca2+.24 In addition, in the Madin-Darby canine kidney (MDCK) epithelial cell line, intracellular Ca2+ is reported to be required both for the formation of and maintaining the integrity of tight junctions.25,26 As the EVL cells of Fundulus heteroclitus are reported to form tight junctions,27 it is likely that such cell contacts may also be present in the EVL in zebrafish. Thus, a possible function of the Ca2+ signals observed during the BP might be to facilitate the formation and maintenance of tight junctions in, and thus the integrity of, the EVL.
It has also been suggested that PI-Ca2+ transients may play a role in patterning the dorso-ventral axis during the BP.22 The idea linking the PI pathway to axis formation in zebrafish embryos resulted from the application of lithium,28,29 which was proposed to block the PI cycle by inhibiting inositol turnover.30 Westfall et al.22 demonstrated in zebrafish that when the PI cycle was blocked and endogenous Ca2+ stores were depleted, then a range of hyperdorsalization phenotypes was observed, and ectopic dorsal signaling centers were formed, demonstrated by the altered subcellular localization of β-catenin and the ectopic expression of β-catenin target genes. Westfall et al.31 subsequently demonstrated that in Wnt5 (pipetail; ppt) mutant embryos, there is reduced Ca2+ activity during the BP and these embryos exhibit hyperdorsalization and partial secondary axis phenotypes, as well as an increase in β-catenin accumulation. Furthermore, they showed that when the Ca2+ cascade is artificially activated with CaMKII in ppt mutants, then the mutant phenotype is partially rescued, thus indicating that the ppt phenotype is a result of reduced Ca2+ release.
Most recently, Lyman Gingerich et al.32 provided further evidence for a role of the EVL Ca2+ transients in both axis formation and gene expression. They demonstrated that in the hecate zebrafish mutant, embryos have defects in the formation of dorso-anterior structures and exhibit ∼10-fold increase in the frequency of intracellular Ca2+ transients that normally occur in the EVL during the BP. In addition, when this Ca2+ release was inhibited in hec mutants, it resulted in the ectopic expression of dorsal genes, thus suggesting that the Ca2+ transients might directly mediate the expression of such genes.32 As well as identifying the Wnt/Ca2+ pathway as a possible upstream trigger of the BP Ca2+ signals, it has also been proposed that CaMKII, PKC and calcineurin/NF-AT might be downstream targets of these signals.4
It has previously been suggested that BP Ca2+ signaling may also play a role in the formation and the function of the yolk syncytial layer (YSL; see Figure 1, panels j and k) because from the 512-1K-cell stage, when the YSL is known to form, distinctive elevated domains of Ca2+ are generated specifically in the marginal blastomeres.18,19,33 Furthermore, a distinctive pattern of Ca2+ signaling is generated at the YSL/blastoderm margin during the subsequent GP when this embryonic domain begins to assume a more prominent role. This is described in more detail in the next section.
During the GP, the morphogenetic cell movements of epiboly, involution, convergence, and extension take place (see Figure 1, panel t), to produce the primary germ layers and the embryonic axis.16 Thus, the zebrafish body plan emerges through an orchestrated pattern of cellular rearrangements, inductive interactions, and gene expression. Several recent reports indicate that during the GP, the embryo generates a number of distinct Ca2+ signaling events. These include both transient non-propagating localized domains of elevated Ca2+,11,34 and a rhythmic series of pan-embryonic intercellular Ca2+ waves,34,35 both of which are illustrated in Figure 2C. The latter are generated by and propagate out from what has been described as a “pacemaker” region, located in the embryonic shield, with an average frequency of ∼7 waves per hour, a velocity of ∼5 μm/s and an estimated amplitude of ∼500 – 1000 nM during their initiation. These waves either circumnavigate the advancing blastoderm margin, or propagate along the forming anterior/posterior axis of the embryo from ∼60-70% epiboly up to the time of yolk cell occlusion.34 It has been suggested that the intercellular transmission of such long-range Ca2+ waves may result from propagation through gap junctions, possibly mediated via the diffusion of either Ca2+ itself or IP3, as proposed by Berridge et al.36 This suggestion is supported by a report that during the GP, there is an increase in the permeability of gap junctions in a circular zone around the blastoderm margin,37 which appears to correlate with both the initiation time and propagation path of the pan-embryonic marginal waves.34,35
A possible upstream trigger of the GP Ca2+ waves might be Fyn kinase. This src-family protein tyrosine kinase has recently been linked to the initiation of epiboly in zebrafish, functioning in part via Ca2+ signaling within the leading edge of the blastoderm.38 The role of Fyn kinase was investigated using dominant-negative constructs designed to suppress the function of c-Fyn. When mRNA encoding dominant-negative FynK299M was introduced at the 1-cell stage, development proceeded normally until the onset of epiboly when the marginal blastomeres failed to migrate toward the vegetal pole. Moreover, analysis of the pattern of Ca2+ signaling in the dominant-negative FynK299M-injected embryos demonstrated that the normally elevated level of Ca2+ in the marginal blastomeres was suppressed.38
The embryonic shield (see Figure 1, panel s) is an organizer region of prime developmental significance in zebrafish.39 While there is no direct evidence yet that confirms a specific role for the rhythmic Ca2+ waves generated by this region, several developmental functions for these signals have been proposed. These include providing positional information to which cells in the process of involuting, converging and extending can relate and respond i.e., the rhythmic Ca2+ waves propagating from the cells in the shield might therefore “remind” other, more distant cells where the organizing center is. Thus, they have a positional point of reference for their global morphogenetic movements, as well as the ability to respond to local signals for more specific developmental instructions.34,35
As many aspects of the GP require the coordinated movement of large populations of cells, another function of the Ca2+ waves might be to synchronize and coordinate cellular responses.40 Considering epiboly, for example, where the blastoderm migrates over and around the yolk cell toward the vegetal pole (VP) in a coordinated manner, it has been suggested that once the blastoderm crosses the ‘equator’ of the yolk cell, an actin-mediated contraction at the blastoderm margin aids its progression to the VP.41 Thus, another developmental function of the circum-marginal Ca2+ waves might be to coordinate and modulate the contraction of this actin-based network in the blastoderm margin. Supporting this suggestion is the fact that the circum-marginal Ca2+ waves are only observed after the margin of the blastoderm crosses the embryonic equator.34,35
In summary, during the GP there is an elaboration of the simple localized intercellular Ca2+ signaling patterns, which were first established during the BP, into patterns of long-distance intercellular signaling. We suggest that the latter might provide a mechanism for coordinating the spatial and temporal regulation of global developmental processes across the whole embryo that are a characteristic of the GP.
During the SP of zebrafish development (see Figure 1, panels v – z), embryos generate a variety of transitory localized patterns of elevated Ca2+. These appear to be associated with three general embryonic domains and their respective morphogenetic fates: the trunk and somite formation (Figure 2Di); the anterior portion of the embryo and sculpturing of the brain rudiment (Figure 2Dii); and the posterior portion of the embryo and formation of the tail (Figure 2Diii). While the exploration of the brain and tail Ca2+ signals in zebrafish has received little attention, several groups have described Ca2+ transients in the developing trunk, and these are now starting to be characterized in further detail.
During somitogenesis, Ca2+ signals have been reported to occur both during the patterning of the paraxial mesoderm when the segmental units (somites) are first established, and also during the formation of the morphological boundaries between the somites (see Figure 1, panel w). Regarding the former, Brennan et al.,42 using a fluorescent Ca2+ reporter, described highly localized waves of elevated intracellular Ca2+ propagating through blocks of anterior presomitic mesoderm (PSM) cells just prior to somite formation. The precise role of this Ca2+ increase was not determined, but they proposed that Ca2+-mediated cell communication via gap junctions might help to determine the cellular boundaries during somitogenesis. Using aequorin, Créton et al.11 described a different type of Ca2+ wave associated with paraxial mesoderm pre-patterning. They reported that an “ultraslow” Ca2+ wave, moving at around ∼0.07 μm/s from 10 – 14 hours post-fertilization, propagated along the trunk in an anterior-to-posterior direction. Créton et al.11 suggested that there might be a correlation between the trunk Ca2+ wave and the formation of the somites and neural keel.
Créton et al.11 also reported that a series of localized intercellular Ca2+ transients were generated along the trunk of segmenting zebrafish embryos and suggested that they might play a role in mediating the contraction events that result in the formation of somitic furrows. Webb and Miller18 subsequently described (again using aequorin) a similar sequence of localized Ca2+ signals along the trunk during the SP in zebrafish and they also proposed that the temporal and spatial characteristics of these signals might correlate with some aspects of somite formation. In both of these reports,11,18 however, embryos were imaged from a lateral view, and as aequorin-based imaging has poor resolution in the z-axis,7 it is hard to draw any definitive conclusions regarding the Ca2+ transients being generated coincidently with the cutting off of each somite pair.
More recently, the Ca2+ signaling events in the trunk during the formation of the first 8-somite pairs were re-examined, this time from a dorsal view in order to visualize both sides of the embryonic mid-line and to better correlate the generation of the Ca2+ transients with somite formation.43 The most striking aspect of these data was the fact that unlike the physical process of cutting off somite pairs that occurs in a regular, predictable, and reproducible sequence,44 there was clearly no regular, reproducible pattern to the Ca2+ transients recorded, both within individual embryos and when comparing one embryo with another.43 The transients did, however, predominantly occur at either the medial or lateral boundaries of the maturing somites, suggesting that they might play a role in determining and/or maintaining these essential margins. Indeed, evidence derived from the manipulation of [Ca2+]i, within the paraxial mesoderm, using caged Ca2+ and a caged Ca2+ chelator, resulted in either a shortening or an elongation of somites in the medio-lateral dimension, respectively, thus supporting this suggested role in margin determination (Leung, Miller, Korzh and Webb, unpublished observations). As a result of these new data, we suggest that the intercellular Ca2+ transients observed in the trunk during the early SP may provide an additional, and as yet not fully understood, level of regulation in establishing and maintaining the medial and lateral boundaries during early somite formation.
Several years ago, it was suggested that there was a lack of good experimental data that makes a definitive causal connection between many of the Ca2+ transients observed during early embryonic patterning and the developmental event with which they are associated.18 Here, we have shown that evidence is now starting to accumulate, which links the various Ca2+ signaling patterns identified to more specific morphological events during the early stages of zebrafish development. Furthermore, there is accumulating evidence to suggest that such post-fertilization Ca2+ signals observed during zebrafish embryogenesis may also occur during development in other systems. For example, Ca2+ signals have been visualized during: (1) The CP; during cytokinesis in the embryos of medaka fish (Oryzias latipes),45 the African clawed frog (Xenopus laevis),46 and the sea urchin (Paracentrotus lividus);47 (2) The BP and GP; coordinating the rhythmic contractile activity of the stellate layer in medaka during gastrulation48, during neural induction49 and convergent extension50 in Xenopus and during dorsal and ventral specification in the fruit fly (Drosophila melanogaster);51 and (4) The SP; during somitogenesis in Xenopus.52 This supports the hypothesis that Ca2+ signaling events might be a common feature of, and indeed may play a crucial role in, key pattern forming events during early embryogenesis. The precise molecular mechanisms involved, however, are still unclear. We hope, therefore, that this review will encourage both on-going and new efforts to establish direct mechanistic connections, and thus help determine the developmental function and significance of the patterns of developmental Ca2+ signaling described.
We acknowledge financial support from Hong Kong RGC grants: HKUST6214/02M, HKUST6279/03M, HKUST6241/04M and HKUST6416/06M. This Review was prepared while A.L.M. was the recipient of a Croucher Senior Research Fellowship. Special thanks to Dr. Osamu Shimomura for his generous supply of aequorins over the years.
1. Jaffe LF. Organization of early development by calcium patterns. BioEssays 1999; 21: 657-67.
2. Berridge MJ, Lipp P, Bootman MD. The versatility and universality of calcium signaling. Nat. Rev. Mol. Cell Biol. 2000; 1: 11-21.
3. Webb SE, Miller AL. Calcium signalling during embryonic development. Nat. Rev. Mol. Cell Biol. 2003; 4: 539-51.
4. Whitaker M. Calcium at fertilization and in early development. Physiol. Rev. 2006; 86: 25-88.
5. Shimomura O, Musicki B, Kishi Y, Inouye S. Light-emitting properties of recombinant semi-synthetic aequorins and recombinant fluorescein-conjugated aequorin for measuring cellular calcium. Cell Calcium 1993; 14: 373-8.
6. Grynkiewicz G, Poenie M, Tsien RY. A new generation of Ca2+ indicators with greatly improved fluorescence properties. J. Biol. Chem. 1985; 260: 3440-50.
7. Miller AL, Karplus E, Jaffe LF. Imaging [Ca2+]i with aequorin using a photon imaging detector. In Nuccitelli R (ed). Methods in Cell Biology. Academic Press, Orlando, FL 1994; Vol. 40: pp 305-37.
8. Chang DC, Meng C. A localized elevation of cytosolic free calcium is associated with cytokinesis in the zebrafish embryo. J. Cell Biol. 1995; 131: 1539-45.
9. Webb SE, Lee KW, Karplus E, Miller AL. Localized calcium transients accompany furrow positioning, propagation, and deepening during the early cleavage period of zebrafish embryos. Dev. Biol. 1997; 192: 78-92.
10. Lee KW, Webb SE, Miller AL. Ca2+ released via IP3 receptors is required for furrow deepening during cytokinesis in zebrafish embryos. Int. J. Dev. Biol. 2003; 47: 411-21.
11. Créton R, Speksnijder JE, Jaffe LF. Patterns of free calcium in zebrafish embryos. J. Cell Sci. 1998; 111: 1613-22.
12. Chang DC, Lu P. Multiple types of calcium signals are associated with cell division in zebrafish embryo. Micros. Res. & Tech. 2000; 49: 111-22.
13. Lee KW, Webb SE, Miller AL. Requirement for a localized, IP3R-generated Ca2+ transient during the furrow positioning process in zebrafish zygotes. Zygote 2006; 14: 143-55.
14. Lee KW, Ho SM, Wong CH, Webb SE, Miller AL. Characterization of mid-spindle microtubules during furrow positioning in early cleavage period zebrafish embryos. Zygote 2004; 12: 221-30.
15. Li WM, Webb SE, Lee KW, Miller AL. Recruitment and SNARE-mediated fusion of vesicles in furrow membrane remodeling during cytokinesis in zebrafish embryos. Exp. Cell Res. 2006; 312: 3260-75.
16. Kimmel CB, Ballard WW, Kimmel SR, Ullmann B, Schilling TF. Stages of embryonic development of the zebrafish. Dev. Dyn. 1995; 203: 253-310.
17. Reinhard E, Yokoe H, Niebling KR, Allbritton NL, Kuhn MA, Meyer T. Localized calcium signals in early zebrafish development. Dev. Biol. 1995; 170: 50-61.
18. Webb SE, Miller AL. Calcium signaling during zebrafish embryonic development. BioEssays 2000; 22: 113-23.
19. Slusarski DC, Yang-Snyder J, Busa WB, Moon RT. Modulation of embryonic intracellular Ca2+ signaling by Wnt-5A. Dev. Biol. 1997; 182: 114-20.
20. Slusarski DC, Corces VC, Moon RT. Interaction of Wnt and a Frizzled homologue triggers G-protein-linked phosphatidylinositol signalling. Nature 1997; 390: 410-3.
21. Mikels AJ, Nusse R. Purified Wnt5a protein activates or inhibits β-catenin-TCF signaling depending on receptor context. PLoS Biol. 2006; 4: 570-82.
22. Westfall TA, Hjertos B, Slusarski DC. Requirement for intracellular calcium modulation in zebrafish dorsal-ventral patterning. Dev. Biol. 2003; 259: 380-91.
23. Jones KW, Elsdale TR. The culture of small aggregates of amphibian embryonic cells in vitro. J. Embryol. Exp. Morph. 1963; 11: 135-54.
24. Knust E, Bossinger O. Composition and formation of intercellular junctions in epithelial cells. Science 2002; 298: 1955-9.
25. Stuart RO, Sun A, Panichas M, Hebert SC, Brenner BM, Nigam SK. Critical role for intracellular calcium in tight junction biogenesis. J. Cell. Physiol. 1994; 159: 423-33.
26. Ye J, Tsukamoto T, Sun A, Nigam SK. A role for intracellular calcium in tight junction reassembly after ATP depletion-repletion. Am. J. Physiol. 1999; 277: F524-32.
27. Fink RD, Cooper MS. Apical membrane turnover is accelerated near cell-cell contacts in an embryonic epithelium. Dev. Biol. 1996; 174: 180-9.
28. Stachel S, Grunwald D, Meyers P. Lithium perturbation and goosecoid expression identify a dorsal specification pathway in the pregastrula zebrafish. Development 1993; 117: 1261-74.
29. Aanstad P, Whitaker M. Predictability of dorso-ventral asymmetry in the cleavage stage zebrafish embryo: an analysis using lithium sensitivity as a dorso-ventral marker. Mech. Dev. 1999; 88: 33-41.
30. Berridge MJ, Downes CP, Hanley MR. Neural and developmental actions of lithium: a unifying hypothesis. Cell 1989; 59: 411-9.
31. Westfall TA, Brimeyer R, Twedt J, Gladon J, Olberding A, Furutani-Seiki M, Slusarski DC. Wnt-5/pipetail functions in vertebrate axis formation as a negative regulator of Wnt/β-catenin activity. J. Cell Biol. 2003; 162: 889-98.
32. Lyman Gingerich J, Westfall TA, Slusarski DC, Pelegri F. hecate, a zebrafish maternal effect gene, affects dorsal organizer induction and intracellular calcium transient frequency. Dev. Biol. 2005; 286: 427-39.
33. Webb SE, Miller AL. Calcium signaling and early embryonic patterning during the blastula and gastrula periods of zebrafish and Xenopus development. Biochem. Biophy. Acta. 2006; 1763: 1192-1208.
34. Gilland E, Miller AL, Karplus E, Baker R, Webb SE. Imaging of multicellular large-scale rhythmic calcium waves during zebrafish gastrulation. Proc. Natl. Acad. Sci. USA 1999; 96: 157-61.
35. Webb SE, Miller AL. Imaging intercellular calcium waves during late epiboly in intact zebrafish embryos. Zygote 2003; 11: 175-82.
36. Berridge MJ, Bootman MD, Roderick HL. Calcium signaling: dynamics, homeostasis and remodeling. Nat. Rev. Mol. Cell Biol. 2003; 4: 517-30.
37. Bozhkova V, Voronov D. Spatial-temporal characteristics of intercellular junctions in early zebrafish and loach embryos before and during gastrulation. Dev. Genes Evol. 1997; 207: 115-26.
38. Sharma D, Holets L, Zhang X, Kinsey WH. Role of fyn kinase in signaling associated with epiboly during zebrafish development. Dev. Biol. 2005; 285: 462-76.
39. Solnica-Krezel L. Pattern formation in zebrafish – fruitful liaisons between embryology and genetics. Curr. Top. Dev. Biol. 1999; 41: 1-35.
40. Meyer T. Cell signaling by second messenger waves. Cell 1991; 64: 675-8.
41. Cheng JC, Miller AL, Webb SE. Organization and function of microfilaments during late epiboly in zebrafish embryos. Dev. Dyn. 2004; 231: 313-23.
42. Brennan C, Amacher SL, Currie PD. IV. Aspects of organogenesis: Somitogenesis. Res. Prob. Cell Differ. 2002; 40: 271-97.
43. Webb SE, Miller AL. Ca2+ signaling during vertebrate somitogenesis. Acta Pharm. Sinica 2006; 27: 781-90.
44. Holley SA, Nüsslein-Volhard C. Somitogenesis in zebrafish. Curr. Top. Dev. Biol. 2000; 47: 247-7.
45. Fluck RA, Miller AL, Jaffe LF. Calcium waves accompany contraction waves in the Oryzias latipes (Medaka) blastoderm. Biol. Bull. 1991; 181: 352.
46. Muto A, Kume S, Inoue T, Okano H, Mikoshiba K. Calcium waves along the cleavage furrows in cleavage-stage Xenopus embryos and its inhibition by heparin. J. Cell Biol. 1996; 135: 181-90.
47. Ciapa B, Pesando D, Wilding M, Whitaker M. Cell-cycle calcium transients driven by cyclic changes in inositol trisphosphate levels. Nature 1994; 368: 875-8.
48. Simon JZ, Cooper MS. Calcium oscillations and calcium waves coordinate rhythmic contractile activity within the stellate cell layer of medaka fish embryos. J. Exp. Zool. 1995; 273: 118-29.
49. Leclerc C, Webb SE, Daguzan C, Moreau M, Miller AL. Imaging patterns of calcium transients during neural induction in Xenopus laevis embryos. J Cell Sci 2000; 113: 3519-29.
50. Wallingford JB, Ewald AJ, Harland RM, Fraser SE. Calcium signaling during convergent extension in Xenopus. Curr Biol. 2001: 11: 652-61.
51. Créton R, Kreiling JA, Jaffe LF. Presence and roles of calcium gradients along the dorsal-ventral axis in Drosophila embryos. Dev. Biol. 2000; 217: 375-85.
52. Ferrari MB, Spitzer NC. Calcium signaling in the developing Xenopus myotome. Dev. Biol. 1999; 213: 3440-50.